Assume that the graphs show a competitive market for the product stated in the question. 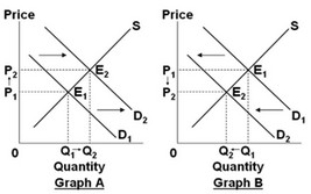
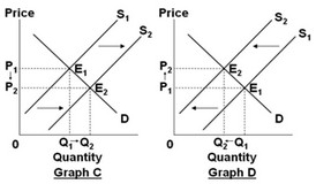 Select the graph above that best shows the change in the market specified in the following situation: the market for chicken, when the price of a substitute, such as beef, decreases.
A) Graph A
B) Graph B
C) Graph C
D) Graph D
Correct Answer:
Verified
Q24: If the newspapers report that there is
Q29: A decrease in the price of multi-touch
Q275: In the diagrams below, the subscript "1"
Q279: In the diagrams below, the subscript "1"
Q280: Assume that the graphs show a competitive
Q324: An increase in the demand for corn
Q327: Which would best explain a decrease in
Q332: What is the likely effect on the
Q343: If a price ceiling is set below
Q348: An increase in demand coupled with a
Unlock this Answer For Free Now!
View this answer and more for free by performing one of the following actions

Scan the QR code to install the App and get 2 free unlocks

Unlock quizzes for free by uploading documents