In the diagrams below, the subscript "1" refers to the initial position of the curve, while the subscript "2" refers to the final position after the curve shifts. 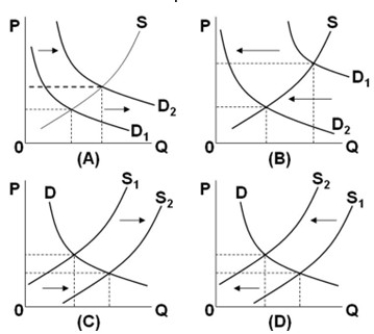 Which diagram illustrates the effect on the natural-gas market of the widespread use of "fracking," or hydraulic fracturing, by gas-drilling companies?
A) A
B) B
C) C
D) D
Correct Answer:
Verified
Q271: A large increase in the supply of
Q277: Assume that the graphs show a competitive
Q279: In the diagrams below, the subscript "1"
Q280: Assume that the graphs show a competitive
Q324: An increase in the demand for corn
Q327: Which would best explain a decrease in
Q332: What is the likely effect on the
Q334: A and B are substitute goods, but
Q343: If a price ceiling is set below
Q348: An increase in demand coupled with a
Unlock this Answer For Free Now!
View this answer and more for free by performing one of the following actions

Scan the QR code to install the App and get 2 free unlocks

Unlock quizzes for free by uploading documents