Multiple Choice
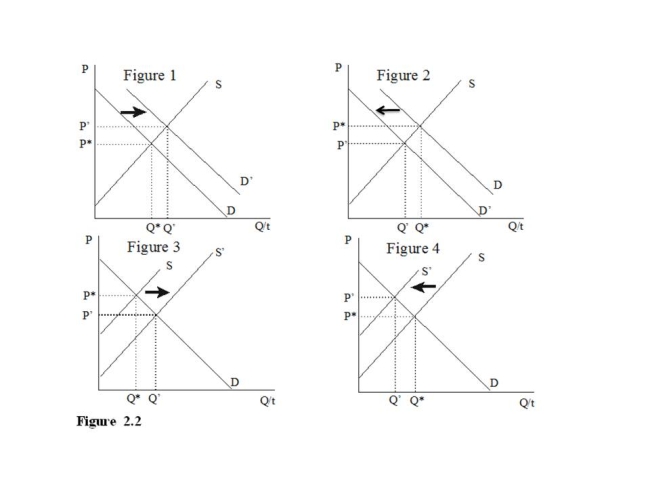
-Of the collection of supply and demand diagrams in Figure 2.2, which one shows the result of an increase in the price of an input in the market for anything?
A) Figure 1
B) Figure 2
C) Figure 3
D) Figure 4
Correct Answer:
Verified
Related Questions

