Multiple Choice
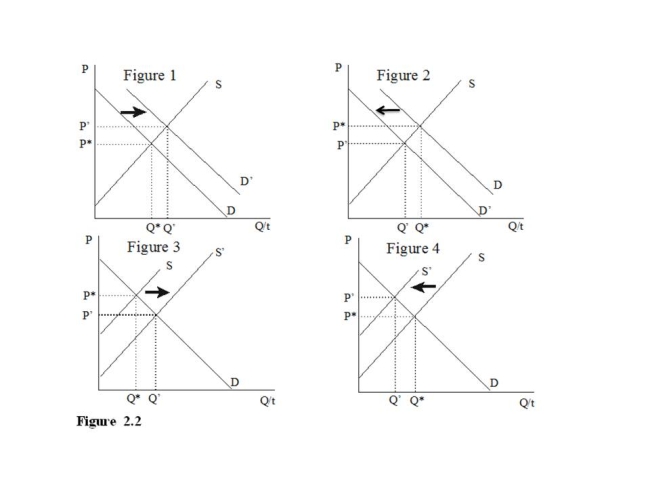
-Of the collection of supply and demand diagrams in Figure 2.2, which one shows the result of a decrease in income if a good is considered normal?
A) Figure 1
B) Figure 2
C) Figure 3
D) Figure 4
Correct Answer:
Verified
Related Questions

