Multiple Choice
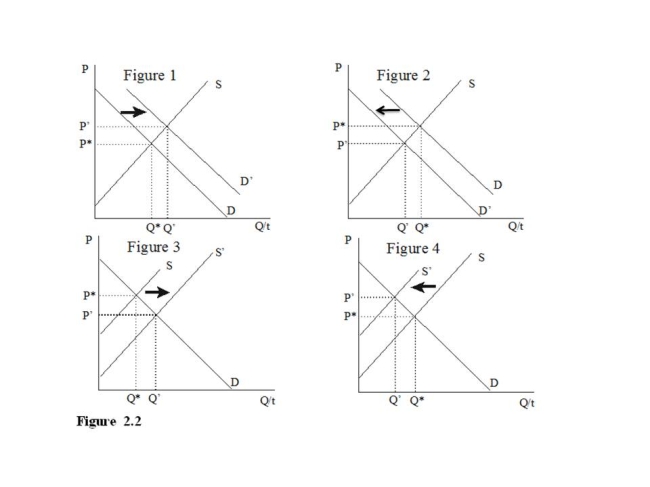
-Of the collection of supply and demand diagrams in Figure 2.2, which one shows the result of a decrease in the price of a complement for a good?
A) Figure 1
B) Figure 2
C) Figure 3
D) Figure 4
Correct Answer:
Verified
Related Questions
Q174: Q175: Q176: Q177: ![]()
![]()
![]()
![]()

