Multiple Choice
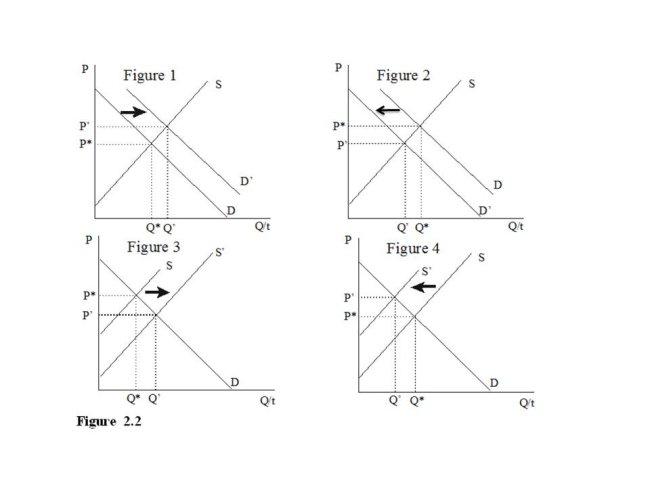
-Of the collection of supply and demand diagrams in Figure 2.2 which one shows the result of a decrease in technology in the market for anything?
A) Figure 1
B) Figure 2
C) Figure 3
D) Figure 4
Correct Answer:
Verified
Related Questions
Q173: Q174: Q175: Q176: Q177: Q179: Q180: Q181: Since teachers are an input in the Q182: On the Heritage Foundation's scale of "Economic Q183: Unlock this Answer For Free Now! View this answer and more for free by performing one of the following actions Scan the QR code to install the App and get 2 free unlocks Unlock quizzes for free by uploading documents![]()
![]()
![]()
![]()
![]()
![]()
![]()
![]()

