The following figure shows the marginal cost curve,average total cost curve,average variable cost curve,and marginal revenue curve for a firm for different levels of output.
Figure 9-3 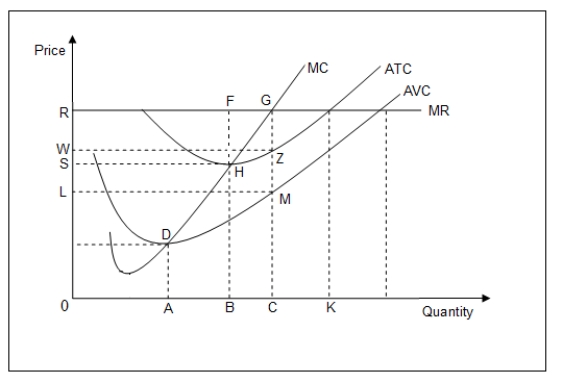
-Refer to Figure 9-3.At the profit-maximizing level of output:
A) the firm is earning economic profit.
B) profits per unit are the highest.
C) profit equals ZC.
D) costs exceed revenue.
Correct Answer:
Verified
Q23: A competitive firm maximizes profit at the
Q25: The following figure shows the total cost
Q26: Profits are maximized at the output level
Q27: The following figure shows the total cost
Q28: The following figure shows the marginal cost
Q29: ref SHAPE \* MERGEFORMAT
The following figure shows
Q31: The competitive firm maximizes its profit by
Q32: Figure 9-4 shows the marginal cost curve,average
Q34: The following figure shows the marginal cost
Q35: The following figure shows the marginal cost
Unlock this Answer For Free Now!
View this answer and more for free by performing one of the following actions

Scan the QR code to install the App and get 2 free unlocks

Unlock quizzes for free by uploading documents