The following figure shows the marginal cost curve,the average cost curve,the average variable cost curve,and the demand curve for a firm over different levels of output.The market price is $P.
Figure 9-4 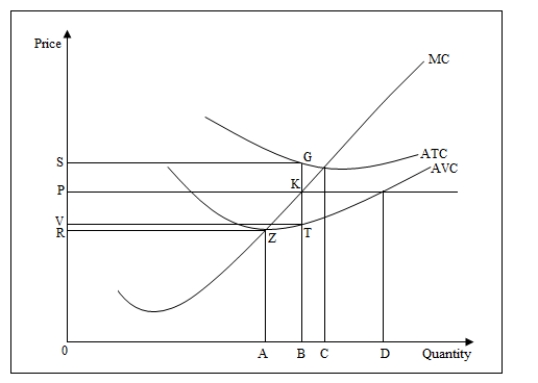
-Refer to Figure 9-4.At a price of $P,the firm will produce the output level _____.
A) OA where marginal cost just covers AVC
B) OB where marginal cost equals the price
C) OC where marginal cost equals ATC
D) OD where the price just covers AVC
Correct Answer:
Verified
Q23: A competitive firm maximizes profit at the
Q25: The perfectly competitive firm maximizes profits by
Q29: ref SHAPE \* MERGEFORMAT
The following figure shows
Q30: The following figure shows the marginal cost
Q31: The competitive firm maximizes its profit by
Q32: Figure 9-4 shows the marginal cost curve,average
Q33: A profit-maximizing firm expands output until marginal
Q35: The following figure shows the marginal cost
Q37: The following figure shows the marginal cost
Q38: The following figure shows the marginal cost
Unlock this Answer For Free Now!
View this answer and more for free by performing one of the following actions

Scan the QR code to install the App and get 2 free unlocks

Unlock quizzes for free by uploading documents