The figure given below shows the demand and supply curves of labor.A per-unit tax imposed on the wage income of the employees shifts the supply curve of labor upward. 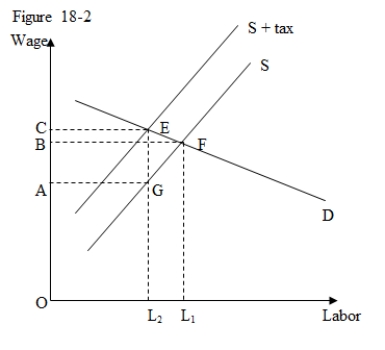
-According to Figure 18-2,the proportion of the per-unit tax paid by the employers is:
A) OA/OB.
B) AB/AC.
C) BC/AC.
D) BC/AB.
Correct Answer:
Verified
Q21: The real burden of a social security
Q22: The federal minimum wage is:
A)not likely an
Q25: When the supply curve of labor is
Q26: The figure given below shows the demand
Q27: The figure given below shows the demand
Q34: The figure given below shows the demand
Q35: The figure given below shows the demand
Q37: Empirical evidence suggests that a large majority
Q38: A change in the social security system
Q39: An aggregate labor supply curve is likely
Unlock this Answer For Free Now!
View this answer and more for free by performing one of the following actions

Scan the QR code to install the App and get 2 free unlocks

Unlock quizzes for free by uploading documents