Multiple Choice
FIGURE 12-5 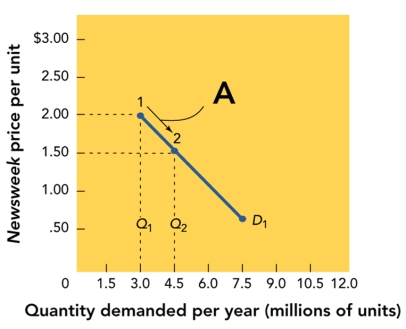
-Figure 12-5 above shows that when the quantity demanded moves from 3.0 to 4.5 million units, the profit
A) stays the same per unit
B) increases from $1.50 to $2.00 per unit.
C) decreases from $2.00 to $1.50 per unit.
D) increases from $.50 to $1.50 per unit.
E) Figure 12-5 does not indicate what happens to profit when the quantity demanded moves.
Correct Answer:
Verified
Related Questions
Q148: While consumer tastes and price and availability
Q170: There are a lot of skateboards on
Q171: A demand curve graph typically appears as
A)a
Q172: Which of the following statements about the
Q173: Demand factors refer to
A) the number of
Q174: The horizontal axis of a demand curve
Q176: Demand curve refers to a graph
A)relating the

