Multiple Choice
FIGURE 12-6 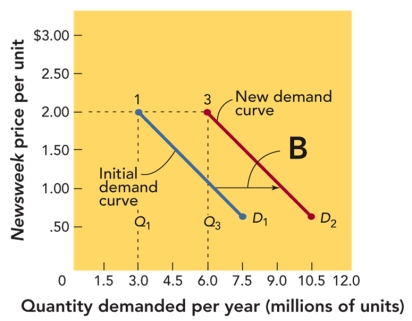
-In Figure 12-6 above, as the two diagonal lines on a demand curve graph show a shift from left to right, it most likely represents
A) an increase in demand that did not require an increase in price.
B) an increase in demand that required an increase in price.
C) no change in price and no change in demand.
D) no change in demand or price but a greater profit due to economies of scale.
E) increases from $.50 to $1.50 per unit.
Correct Answer:
Verified
Related Questions
Q148: While consumer tastes and price and availability
Q174: The horizontal axis of a demand curve

