FIGURE 8-20 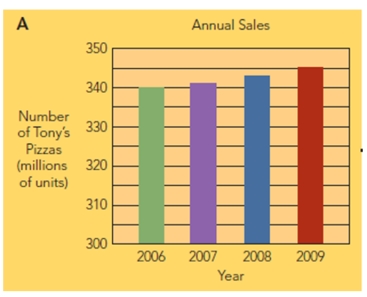
-Figure 8-20 above indicates that
A) annual sales of Tony's Pizzas are flat to slightly increasing over the period 2006-2009.
B) annual sales of Tony's pizzas are increasing significantly over the period 2006-2009.
C) children are eating more pizzas.
D) households with more members are eating more pizza, which drives this sales increase.
E) there was a greater change in growth between 2006 and 2007 than there was between 2008 and 2009.
Correct Answer:
Verified
Q163: A collection of databases that store,organize,and manage
Q188: The extraction of hidden predictive information from
Q190: Drivers are used with which of the
Q191: Whereas _ are facts and figures, _
Q192: Information technology refers to
A)any information derived from
Q194: Analyzing data and presenting findings would take
Q195: When Procter & Gamble Co.acquired the Old
Q196: When a marketing manager begins asking "what
Q197: As marketing vice president of Health Care
Q198: When conducting marketing experiments, the independent variable
Unlock this Answer For Free Now!
View this answer and more for free by performing one of the following actions

Scan the QR code to install the App and get 2 free unlocks

Unlock quizzes for free by uploading documents