What type of graph depicts the data below? 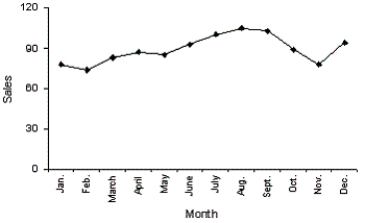
A) A line chart
B) A histogram
C) A dot plot
D) A bar chart
Correct Answer:
Verified
Q66: A line chart is created by plotting
Q67: Beef prices throughout the year (month 1
Q68: Explain the difference between a histogram and
Q69: A department store's monthly sales (in thousands
Q70: Observations that are measured at successive points
Q72: The line chart below shows tomato prices
Q73: Which of the following statements describe(s)the line
Q74: Observations that are taken during successive points
Q75: Observations that are measured at the same
Q76: Which of the following statements describes a
Unlock this Answer For Free Now!
View this answer and more for free by performing one of the following actions

Scan the QR code to install the App and get 2 free unlocks

Unlock quizzes for free by uploading documents