Which of the following statements describe(s) the line chart below? 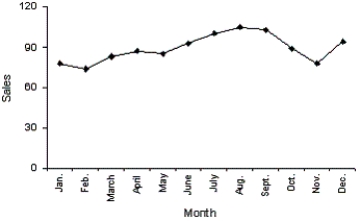
A) November experienced the lowest sales throughout the year.
B) August experienced the highest sales throughout the year.
C) Sales did not fluctuate more than 30 units on either side of 90.
D) All of these choices are true.
Correct Answer:
Verified
Q68: Explain the difference between a histogram and
Q69: A department store's monthly sales (in thousands
Q70: Observations that are measured at successive points
Q71: What type of graph depicts the data
Q72: The line chart below shows tomato prices
Q74: Observations that are taken during successive points
Q75: Observations that are measured at the same
Q76: Which of the following statements describes a
Q77: Time-series data are often graphically depicted how?
A)Bar
Q78: The line chart below shows cucumber prices
Unlock this Answer For Free Now!
View this answer and more for free by performing one of the following actions

Scan the QR code to install the App and get 2 free unlocks

Unlock quizzes for free by uploading documents