Multiple Choice
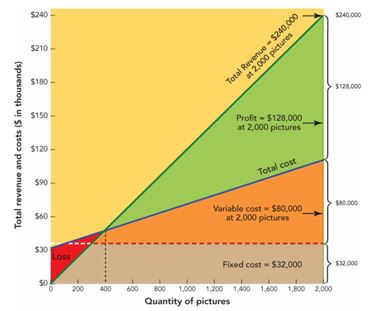
-Figure 11-6 above depicts a __________.
A) Gantt chart
B) demand curve
C) break-even chart
D) ROI analysis
E) cross-tabulation
Correct Answer:
Verified
Related Questions
Q170: Unit variable cost refers to variable cost
Q172: The unit variable cost (UVC) equals variable
Q173: Fixed cost refers to
A)the sum of the
Q188: You are selling a new line of
Q197: Each month, the owner of a car
Q205: Ampro-Mag is a small company that makes
Q226: A graphic presentation of the break-even analysis
Unlock this Answer For Free Now!
View this answer and more for free by performing one of the following actions

Scan the QR code to install the App and get 2 free unlocks

Unlock quizzes for free by uploading documents