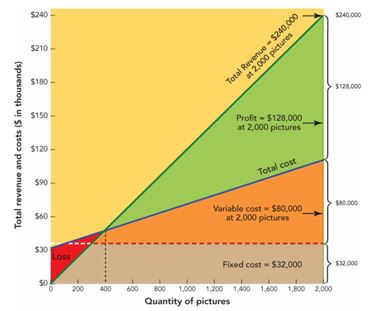
-In Figure 11-6 above, which is a break-even chart that depicts a graphic presentation of a break-even analysis for a picture frame store, the triangular area GAF represents the firm's
A) fixed costs.
B) break-even point.
C) variable costs.
D) profit.
E) total revenue
Correct Answer:
Verified
Q81: All of the following are examples of
Q95: Pricing objectives refer to
A)reconciling the prices charged
Q236: Break-even analysis refers to
A)a process that investigates
Q237: Q238: A break-even chart refers to a graphic Q239: The owner of a take-out fried chicken Q240: The quantity at which total revenue and Q244: Jason decided to open a small Internet![]()
Unlock this Answer For Free Now!
View this answer and more for free by performing one of the following actions

Scan the QR code to install the App and get 2 free unlocks

Unlock quizzes for free by uploading documents