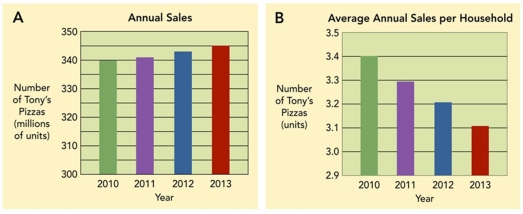
 Figure 7-6A: Annual Sales of Tony's Pizza and Figure 7-6B: Average Annual Sales of Tony's Pizza per Household
-Interpret and contrast Figure 7-6A and Figure 7-6B for Tony's Pizza. What findings would you present based on this information?
Correct Answer:
Verified
View Answer
Unlock this answer now
Get Access to more Verified Answers free of charge
Q260: A salesforce survey forecast involves
A)asking prospective customers
Q274: What is neuromarketing? What does it do?
Q279: Explain why measures of success are important
Q283: In conducting marketing research on Facebook,Carmex is
Q286: Briefly explain the difference between a direct
Unlock this Answer For Free Now!
View this answer and more for free by performing one of the following actions

Scan the QR code to install the App and get 2 free unlocks

Unlock quizzes for free by uploading documents