The following diagram shows a close-up view of the vapor pressure curves for two pure liquids and two different solutions composed of these two liquids.Which curves represent pure liquids and which curves represent the solutions? 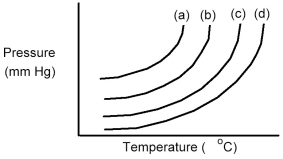
A) Curves (a) and (b) are the pure liquids and curves (c) and (d) are the solutions.
B) Curves (a) and (c) are the pure liquids and curves (b) and (d) are the solutions.
C) Curves (a) and (d) are the pure liquids and curves (b) and (c) are the solutions.
D) Curves (c) and (d) are the pure liquids and curves (a) and (b) are the solutions.
Correct Answer:
Verified
Q105: A phase diagram of temperature versus composition
Q106: A phase diagram of temperature versus composition
Q109: A phase diagram of temperature versus composition
Q137: Drawings (1)and (2)show the equilibrium vapor pressures
Q138: At 80°C,pure liquid A has a vapor
Q141: What volume of a 0.716 M KBr
Q142: How many grams of KBr are required
Q143: What molality of pentane is obtained by
Q144: Which cation in each set is expected
Q145: What volume of 3.00 M CH3OH solution
Unlock this Answer For Free Now!
View this answer and more for free by performing one of the following actions

Scan the QR code to install the App and get 2 free unlocks

Unlock quizzes for free by uploading documents