Figure 36-1.The left-hand graph shows a short-run aggregate-supply (SRAS) curve and two aggregate-demand (AD) curves.On the right-hand diagram,U represents the unemployment rate. 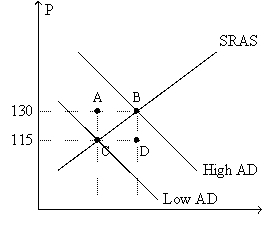
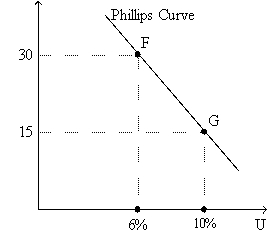
-Refer to Figure 36-1.The curve that is depicted on the right-hand graph offers policymakers a "menu" of combinations
A) that applies both in the short run and in the long run.
B) that is relevant to choices involving fiscal policy,but not to choices involving monetary policy.
C) of inflation and unemployment.
D) All of the above are correct.
Correct Answer:
Verified
Q9: In the long run,
A)the natural rate of
Q9: In the late 1960s,Milton Friedman and Edmund
Q11: Figure 36-3.The left-hand graph shows a short-run
Q18: The equation,
Unemployment rate = Natural rate of
Q19: Samuelson and Solow argued that a combination
Q22: If the central bank decreases the money
Q27: If the short-run Phillips curve were stable,which
Q40: If policymakers decrease aggregate demand,then in the
Q57: A policy that raised the natural rate
Q86: According to Friedman and Phelps,the unemployment rate
A)is
Unlock this Answer For Free Now!
View this answer and more for free by performing one of the following actions

Scan the QR code to install the App and get 2 free unlocks

Unlock quizzes for free by uploading documents