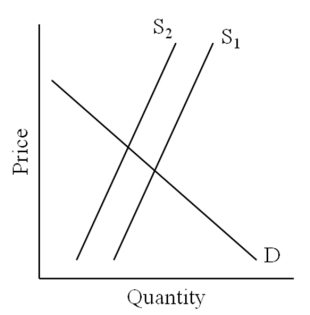
-A shift in the above graph from S1 to S2 may represent
A) a tax increase.
B) a tax decrease.
C) the imposition of a price ceiling.
D) the imposition of a price floor.
Correct Answer:
Verified
Q83: Q84: Q85: An elasticity that would be considered only Q86: Advertisers try to Q87: In general taxes on goods and services Q89: Statement I: A perfectly elastic demand curve Q90: Over time,the supply of a particular good Q91: A 4% decline in the price of Q92: A perfectly inelastic supply curve is Q93: If the supply of steel is perfectly![]()
![]()
A)raise the demand for their
A)are
A)horizontal.
B)vertical.
C)positively sloped.
D)negatively
Unlock this Answer For Free Now!
View this answer and more for free by performing one of the following actions

Scan the QR code to install the App and get 2 free unlocks

Unlock quizzes for free by uploading documents