Multiple Choice
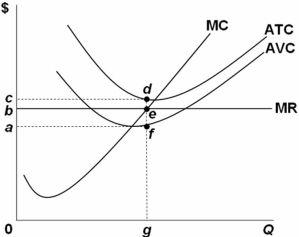 Refer to the above graph.It shows a profit-maximizing,purely competitive firm operating in the short run.Which area in the graph represents the amount the firm can save by continuing to produce in the short run rather than closing down immediately?
A) 0beg
B) 0cdg
C) acdf
D) abef
Correct Answer:
Verified
Related Questions
Q64: The table below shows cost data for
Q65: When a firm produces less output,it can
Q66: A firm should increase the quantity of
Q67: Q68: The individual firm's short-run supply curve is Q70: A firm should always continue to operate Unlock this Answer For Free Now! View this answer and more for free by performing one of the following actions Scan the QR code to install the App and get 2 free unlocks Unlock quizzes for free by uploading documents![]()

