Multiple Choice
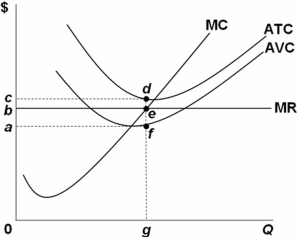 Refer to the above graph.It shows a profit-maximizing,purely competitive firm operating in the short run.Which area in the graph represents the amount of economic loss for the firm?
A) 0beg
B) bcde
C) acdf
D) abef
Correct Answer:
Verified
Related Questions
Q68: The individual firm's short-run supply curve is
Q69: Q70: A firm should always continue to operate Q71: Q72: A purely competitive firm is in short-run Q74: The table below shows cost data for Q75: The Campus Crustacean Company receives $2 per Unlock this Answer For Free Now! View this answer and more for free by performing one of the following actions Scan the QR code to install the App and get 2 free unlocks Unlock quizzes for free by uploading documents![]()
![]()

