Figure 10.10 depicts the cost and revenue curves for a monopolist.
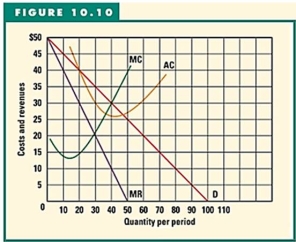
-Refer to Figure 10.10 to answer this question.At the profit-maximizing level of output,what is the amount of total costs?
A) $20.
B) $600.
C) $900.
D) $1,200.
E) Cannot be determined from this information.
Correct Answer:
Verified
Q112: All,except one,of the following statements regarding the
Q113: Table 10.5,which is data for a monopolist.
Q114: Under what circumstances will a profit-maximizing monopolist
Q115: Suppose a monopolist was charging a price
Q116: All of the following,except one,are examples of
Q118: Figure 10.10 depicts the cost and revenue
Q119: Figure 10.10 depicts the cost and revenue
Q120: Table 10.4 outlines the cost and revenue
Q121: A monopolist will only be able to
Q122: A monopolist is free to charge any
Unlock this Answer For Free Now!
View this answer and more for free by performing one of the following actions

Scan the QR code to install the App and get 2 free unlocks

Unlock quizzes for free by uploading documents