The graph below shows the supply and demand for tickets to a Raptors basketball game.
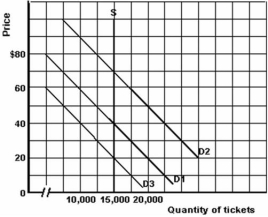
-Refer to the graph above to answer this question.All of the statements below,except one are correct.Which is the exception?
A) If the price of a ticket is $40 and demand is D3,then there will be 5,000 unsold tickets.
B) If the price of a ticket is $60 and demand is D2,then there is a shortage of 2,500 seats.
C) If the price of a ticket is $20 and demand is D1,then 5,000 people who would like to attend the game will not be able to unless they are able to buy a ticket from a scalper.
D) Any price under $40 will result in all the tickets being sold regardless of which of the three demand curves is considered.
Correct Answer:
Verified
Q92: What is the formula used to calculate
Q93: Suppose that the value of the income
Q94: Suppose that average incomes decreased from $38,000
Q95: The graph below shows the supply and
Q96: The graph below shows the supply and
Q98: The graph below shows the supply and
Q99: Suppose that the price of a product
Q100: Suppose that the value of the supply
Q101: Suppose that the cross elasticity of demand
Q102: Below is some information on the demand
Unlock this Answer For Free Now!
View this answer and more for free by performing one of the following actions

Scan the QR code to install the App and get 2 free unlocks

Unlock quizzes for free by uploading documents