The graph below shows the supply and demand for tickets to a Raptors basketball game.
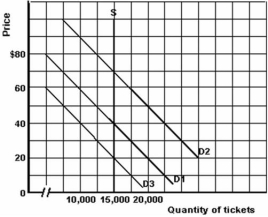
-Refer to the graph above to answer this question.Which of the following statements is correct regarding the change in the demand curve from D1 to D2?
A) Demand has decreased by 7,500.
B) Demand has increased by 7,500.
C) Demand has decreased by 20.
D) Demand has increased by 20.
E) None of the choices are correct.
Correct Answer:
Verified
Q93: Suppose that the value of the income
Q94: Suppose that average incomes decreased from $38,000
Q95: The graph below shows the supply and
Q96: The graph below shows the supply and
Q97: The graph below shows the supply and
Q99: Suppose that the price of a product
Q100: Suppose that the value of the supply
Q101: Suppose that the cross elasticity of demand
Q102: Below is some information on the demand
Q103: What is the effect of a rise
Unlock this Answer For Free Now!
View this answer and more for free by performing one of the following actions

Scan the QR code to install the App and get 2 free unlocks

Unlock quizzes for free by uploading documents