The graph below is Mendork's production possibility curve for the only two goods that it produces-quirks and quarks.
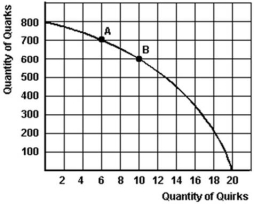
-Refer to the graph above to answer this question.If Mendork's current production is at point B,what is the opportunity cost of one more quark as output changes from point B to A?
A) 0.04 quirks.
B) 4 quirks.
C) 400 quirks.
D) 1 quirk.
E) 0.4 quirks.
Correct Answer:
Verified
Q52: Below is a production possibilities curve for
Q53: Below is a production possibilities curve for
Q54: Below is a production possibilities curve involving
Q55: Below is a production possibilities curve involving
Q56: Below is a production possibilities curve involving
Q58: Below are some production possibilities data for
Q59: The graph below is Mendork's production possibility
Q60: The graph below is Mendork's production possibility
Q61: Below are some production possibilities data for
Q62: What are the factors of production?
A)Land,labour,money,and enterprise.
B)Land,labour,money,and
Unlock this Answer For Free Now!
View this answer and more for free by performing one of the following actions

Scan the QR code to install the App and get 2 free unlocks

Unlock quizzes for free by uploading documents