Below is a production possibilities curve involving tea and videos.
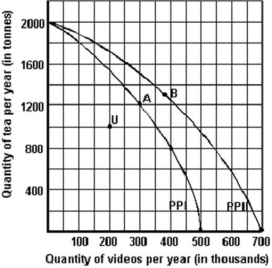
-Refer to the graph above to answer this question.What is indicated by the shape of both the PPI and the PPII curves?
A) Constant costs.
B) Alternative costs.
C) Increasing costs.
D) Decreasing costs.
Correct Answer:
Verified
Q51: Below is a production possibilities curve involving
Q52: Below is a production possibilities curve for
Q53: Below is a production possibilities curve for
Q54: Below is a production possibilities curve involving
Q55: Below is a production possibilities curve involving
Q57: The graph below is Mendork's production possibility
Q58: Below are some production possibilities data for
Q59: The graph below is Mendork's production possibility
Q60: The graph below is Mendork's production possibility
Q61: Below are some production possibilities data for
Unlock this Answer For Free Now!
View this answer and more for free by performing one of the following actions

Scan the QR code to install the App and get 2 free unlocks

Unlock quizzes for free by uploading documents