The table compares what students at a Canadian college did after graduating in 1992,1998,and 2003. 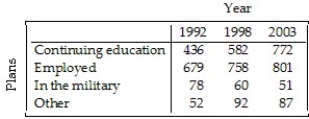
Create a segmented bar graph which shows the conditional distributions of plans for each of the three years.
Correct Answer:
Verified
Q55: Most women who have had a mastectomy
Q56: The table below compares what students at
Q57: The focus of a recent survey was
Q58: A company held a cholesterol screening clinic
Q59: A company must decide which of two
Q60: Students in a political science course were
Q61: A survey of automobiles parked in student
Q62: Students in a Political Science course were
Q63: A company held a cholesterol screening clinic
Q64: Students in a Political Science course were
Unlock this Answer For Free Now!
View this answer and more for free by performing one of the following actions

Scan the QR code to install the App and get 2 free unlocks

Unlock quizzes for free by uploading documents