Office workers were asked how long it took them to travel to work one morning.Here is the stem-and-leaf display. 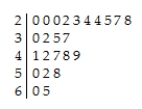
Would you use the median or the mean to describe the centre of this distribution?
A) Mean,because the data are skewed to the right.
B) Median,because the data are skewed to the left.
C) Mean,because the data are skewed to the left.
D) Mean,because the data are symmetric.
E) Median,because the data are skewed to the right.
Correct Answer:
Verified
Q13: The histogram shows the cost of living,in
Q15: The display shows the heights of Grade
Q16: The histograms display the body fat percentages
Q17: The histogram shows the sizes (in acres)of
Q17: Number of innings in the baseball games
Q19: The histogram shows the lengths of hospital
Q20: Here are summary statistics of the four
Q21: The histograms show the cost of living,in
Q22: The annual incomes,in dollars,of several doctors are
Q23: A new business had the following monthly
Unlock this Answer For Free Now!
View this answer and more for free by performing one of the following actions

Scan the QR code to install the App and get 2 free unlocks

Unlock quizzes for free by uploading documents