The histograms show the cost of living,in dollars,for 32 Canadian cities.The histogram on the left shows the cost of living for the 32 cities using bins $10 wide,and the histogram on the right displays the same data using bins that are $6 wide. 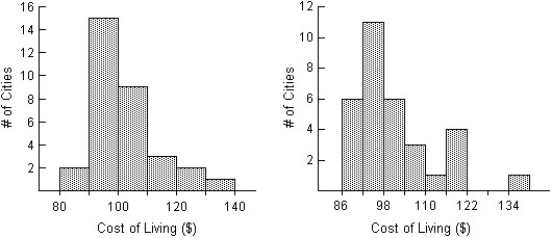
Compare the distributions (shape,centre,spread,unusual features) .
A) The distribution in the left histogram of the cost of living in the 32 Canadian cities is unimodal and skewed to the right.The distribution is centred around $100,and spread out,with values ranging from $80 to $140.The distribution in the right histogram appears bimodal,with many cities costing just under $104 and another smaller cluster around $119.There also appears to be an outlier in the right histogram at $134 that was not apparent in the histogram on the left.
B) The distribution in the left histogram of the cost of living in the 32 Canadian cities is unimodal and skewed to the right.The distribution is centred around $100,and spread out,with values ranging from $80 to $140.The distribution in the right histogram is unimodal and symmetric.The distribution is centred around $104,and spread out,with values ranging from $86 to $140.There also appears to be an outlier in the right histogram at $134 that was not apparent in the histogram on the left.
C) The distribution in the left histogram of the cost of living in the 32 Canadian cities is unimodal and skewed to the left.The distribution is centred around $100,and spread out,with values ranging from $80 to $140.The distribution in the right histogram appears bimodal,with many cities costing just under $104 and another smaller cluster around $119.There also appears to be an outlier in the right histogram at $134 that was not apparent in the histogram on the left.
D) The distribution in the left histogram of the cost of living in the 32 Canadian cities is unimodal and skewed to the right.The distribution is centred around $100,and spread out,with values ranging from $80 to $140.The distribution in the right histogram is also unimodal and skewed to the right.The distribution is centred around $104,and spread out,with values ranging from $86 to $140.There also appears to be an outlier in the right histogram at $134 that was not apparent in the histogram on the left.
E) The distribution in the left histogram of the cost of living in the 32 Canadian cities is unimodal and skewed to the right.The distribution is centred around $100,and spread out,with values ranging from $80 to $140.The distribution in the right histogram appears bimodal,with many cities costing just under $104 and another smaller cluster around $119.
Correct Answer:
Verified
Q14: Shown below are the boxplot and the
Q15: Describe what these boxplots tell you about
Q16: Do men and women run a 5-kilometre
Q18: Shown below are the boxplot and the
Q20: Which class had the highest mean score?
A)Class
Q20: The back-to-back stem-and-leaf display compares the percent
Q21: The weekly salaries (in dollars)of 24 randomly
Q22: The weekly salaries (in dollars)of sixteen government
Q23: Here is the stem-and-leaf display of the
Q24: Here are boxplots of the points scored
Unlock this Answer For Free Now!
View this answer and more for free by performing one of the following actions

Scan the QR code to install the App and get 2 free unlocks

Unlock quizzes for free by uploading documents