The back-to-back stem-and-leaf display compares the percent growth in sales for a retail chain's stores located in two regions of Canada.The lower stem contains leaves with the digits 0-4 and the upper stem contains leaves with digits 5-9. 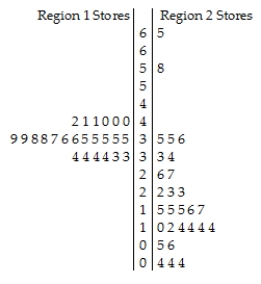
Key:
3 | 5 = 35% sales growth
A) The distribution of sales growth in Region 1 stores is unimodal,symmetric and tightly clustered around 35% growth.The distribution of sales growth in Region 2 stores is much more spread out,with most stores having sales growth between 5% and 35%.A typical Region 2 store had about 15% growth.There were two outliers,one store with 58% growth and another with 65% growth.Generally,the sales growth rates in the Region 2 stores were higher and more variable than the rates in the Region 1 stores.
B) The distribution of sales growth in the Region 1 stores is unimodal,symmetric and tightly clustered around 35% growth.The distribution of sales growth in Region 2 stores is much more spread out,with most stores having sales growth between 5% and 35%.A typical Region 2 store had about 15% growth.There were two outliers,one store with 58% growth and another with 65% growth.Generally,the sales growth rates in the Region 1 stores were higher and less variable than the rates in the Region 2 stores.
C) The distribution of sales growth in Region 1 stores is unimodal,symmetric and tightly clustered around 35% growth.The distribution of sales growth in Region 2 stores is much more spread out,with most stores having sales growth between 5% and 35%.A typical Region 2 store had about 15% growth.There were two outliers,one store with 58% growth and another with 65% growth.Generally,the sales growth rates in the Region 1 stores were higher and more variable than the rates in the Region 2 stores.
D) The distribution of sales growth in Region 1 stores is unimodal,symmetric and tightly clustered around 45% growth.The distribution of sales growth in Region 2 stores is much more spread out,with most stores having sales growth between 5% and 35%.A typical Region 2 store had about 25% growth.There were two outliers,one store with 58% growth and another with 65% growth.Generally,the sales growth rates in the Region 2 stores were higher and more variable than the rates in the Region 1 stores.
E) The distribution of sales growth in Region 1 stores is unimodal,symmetric and tightly clustered around 45% growth.The distribution of sales growth in Region 2 stores is much more spread out,with most stores having sales growth between 5% and 35%.A typical Region 2 store had about 25% growth.There were two outliers,one store with 58% growth and another with 65% growth.Generally,the sales growth rates in the Region 1 stores were higher and less variable than the rates in the Region 2 stores.
Correct Answer:
Verified
Q15: Describe what these boxplots tell you about
Q16: Do men and women run a 5-kilometre
Q18: Shown below are the boxplot and the
Q19: The histograms show the cost of living,in
Q20: Which class had the highest mean score?
A)Class
Q21: The weekly salaries (in dollars)of 24 randomly
Q22: The weekly salaries (in dollars)of sixteen government
Q23: Here is the stem-and-leaf display of the
Q24: Here are boxplots of the points scored
Q25: Shown below are the histogram and summary
Unlock this Answer For Free Now!
View this answer and more for free by performing one of the following actions

Scan the QR code to install the App and get 2 free unlocks

Unlock quizzes for free by uploading documents