A student at a local university took a total of 20 exams during freshman year.The student recorded the exam scores as percentages and created the following stem-and-leaf display.The lower stem contains leaves with the digits 0-4 and the upper stem contains leaves with digits 5-9.In addition to describing the distribution,give a reason to account for the shape of this distribution. 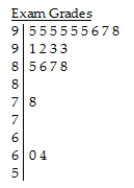
Key:
9 | 2 = 92%
A) The distribution of exam scores is skewed to the right.Typically,the student scored 95% on exams,and the exam scores are tightly clustered in the 90s.Two exam scores are outliers,when the student scored below 65%.It is possible that the student had a difficult time with one of his or her courses in that year.Regardless of the possible reasons,these two scores were unusual compared to the student's other exam scores.
B) The distribution of exam scores is skewed to the left.Typically,the student scored 95% on exams,and the exam scores are tightly clustered in the upper 80s and lower 90s.Two exam scores are outliers,when the student scored below 65%.It is possible that the student had a difficult time with one of his or her courses in that year.Regardless of the possible reasons,these two scores were unusual compared to the student's other exam scores.
C) The distribution of exam scores is skewed to the left.Typically,the student scored 95% on exams,and the exam scores are tightly clustered in the 90s.Two exam scores are outliers,when the student scored below 65%.It is possible that the student had a difficult time with one of his or her courses in that year.Regardless of the possible reasons,these two scores were unusual compared to the student's other exam scores.
D) The distribution of exam scores is skewed to the left.Typically,the student scored 93% on exams,and the exam scores are tightly clustered in the 90s.Two exam scores are outliers,when the student scored below 65%.It is possible that the student had a difficult time with one of his or her courses in that year.Regardless of the possible reasons,these two scores were unusual compared to the student's other exam scores.
E) The distribution of exam scores is skewed to the left.Typically,the student scored 95% on exams,and the exam scores are tightly clustered in the 90s.
Correct Answer:
Verified
Q92: Here is the boxplot and an ogive
Q93: Here is a histogram of the assets
Q94: Use the high closing values of Naristar
Q95: Members of the Ontario Field Ornithologists (OFO)observe
Q96: The mathematics department at a community college
Q98: The following stem-and-leaf display shows the number
Q99: A business owner recorded her annual profits
Q100: Here is a histogram of the assets
Q101: In a child psychology course,children took part
Q102: Here is a histogram of the assets
Unlock this Answer For Free Now!
View this answer and more for free by performing one of the following actions

Scan the QR code to install the App and get 2 free unlocks

Unlock quizzes for free by uploading documents