The mathematics department at a community college collected data for the number of students enrolled in 40 math courses over the course of one year.The following stem-and-leaf display shows the total number of students enrolled in each class. 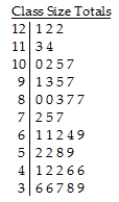
Key:
10 | 5 = 105 students
A) The distribution of the number of students enrolled in each of 40 math courses is nearly uniform.The smallest class size was 36 and the largest was 122.The centre of the distribution was around 88 students.
B) The distribution of the number of students enrolled in each of 40 math courses is skewed to the left,with a typical class size of 88 students.The smallest class size was 36 and the largest was 122.
C) The distribution of the number of students enrolled in each of 40 math courses is unimodal and symmetric.The smallest class size was 36 and the largest was 122.The centre of the distribution was around 75 students.
D) The distribution of the number of students enrolled in each of 40 math courses is skewed to the right,with a typical class size of 69 students.The smallest class size was 36 and the largest was 122.
E) The distribution of the number of students enrolled in each of 40 math courses is nearly uniform.The smallest class size was 36 and the largest was 122.The centre of the distribution was around 75 students.
Correct Answer:
Verified
Q91: Here is a histogram of the assets
Q92: Here is the boxplot and an ogive
Q93: Here is a histogram of the assets
Q94: Use the high closing values of Naristar
Q95: Members of the Ontario Field Ornithologists (OFO)observe
Q97: A student at a local university took
Q98: The following stem-and-leaf display shows the number
Q99: A business owner recorded her annual profits
Q100: Here is a histogram of the assets
Q101: In a child psychology course,children took part
Unlock this Answer For Free Now!
View this answer and more for free by performing one of the following actions

Scan the QR code to install the App and get 2 free unlocks

Unlock quizzes for free by uploading documents