Use the high closing values of Naristar Inc.stock from the years 1990 - 2001 to construct a timeplot. 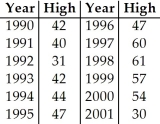
Correct Answer:
Verified
Q76: Here are the summary statistics for the
Q78: The weekly salaries (in dollars)of 24 randomly
Q79: Here are some summary statistics for all
Q80: Shown below are the boxplot,the histogram and
Q82: A business owner recorded her annual profits
Q83: A class of sixth graders takes a
Q84: Here is a histogram of the assets
Q85: A medical study of the effects of
Q86: Here is the stem-and-leaf display of the
Q126: The speed vehicles travelled on a local
Unlock this Answer For Free Now!
View this answer and more for free by performing one of the following actions

Scan the QR code to install the App and get 2 free unlocks

Unlock quizzes for free by uploading documents