Here is a histogram of the assets (in millions of dollars) of 71 companies.What aspect of this distribution makes it difficult to summarize,or to discuss,the centre and spread? What could be done with these data to make it easier to discuss the distribution? 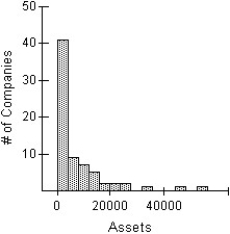
A) The distribution of assets of the 71 companies is heavily skewed to the right.The vast majority of the companies have assets represented in the first bar of the histogram,0 to 4000 dollars.This makes the discussion of the distribution meaningless.Re-expressing these data using logs or square roots might make the distribution nearly symmetric,and a meaningful discussion of centre and spread might be possible.
B) The distribution of assets of the 71 companies is heavily skewed to the left.The vast majority of the companies have assets represented in the first bar of the histogram,0 to 4 billion dollars.This makes the discussion of the distribution meaningless.Re-expressing these data using logs or square roots might make the distribution nearly symmetric,and a meaningful discussion of centre and spread might be possible.
C) The distribution of assets of the 71 companies is heavily skewed to the right.The vast majority of the companies have assets represented in the first bar of the histogram,0 to 4 billion dollars.This makes the discussion of the distribution meaningless.Re-expressing these data using logs or squares might make the distribution nearly symmetric,and a meaningful discussion of centre and spread might be possible.
D) The distribution of assets of the 71 companies is heavily skewed to the right.The vast majority of the companies have assets represented in the first bar of the histogram,0 to 4000 dollars.This makes the discussion of the distribution meaningless.Re-expressing these data using logs or squares might make the distribution nearly symmetric,and a meaningful discussion of centre and spread might be possible.
E) The distribution of assets of the 71 companies is heavily skewed to the right.The vast majority of the companies have assets represented in the first bar of the histogram,0 to 4 billion dollars.This makes the discussion of the distribution meaningless.Re-expressing these data using logs or square roots might make the distribution nearly symmetric,and a meaningful discussion of centre and spread might be possible.
Correct Answer:
Verified
Q79: Here are some summary statistics for all
Q80: Shown below are the boxplot,the histogram and
Q81: Use the high closing values of Naristar
Q82: A business owner recorded her annual profits
Q83: A class of sixth graders takes a
Q85: A medical study of the effects of
Q86: Here is the stem-and-leaf display of the
Q87: Use the Olympic gold medal performances in
Q88: The stem-and-leaf diagram shows the ages of
Q89: In May 2011,17 coffee shops in Vancouver
Unlock this Answer For Free Now!
View this answer and more for free by performing one of the following actions

Scan the QR code to install the App and get 2 free unlocks

Unlock quizzes for free by uploading documents