The figure below shows the association between life expectancy and infant mortality for several different countries.Also shown is the equation and correlation from a regression analysis.What is the correct conclusion to draw from the figure? 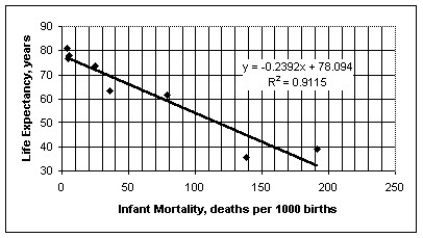
A) Countries that have low life expectancies and high infant mortality rates seem to have less regard for the sanctity of human life.
B) While there appears to be a very strong association,there is probably not a cause-and-effect relationship between infant mortality and life expectancy.Access to basic health care is probably a lurking variable that drives both life expectancy and infant mortality.
C) Those countries with low life expectancies clearly have no regard for children or expectant mothers.
D) The association must be coincidental.I would expect the association to have a positive slope,not the negative one illustrated above.
E) High infant mortality is causing reduced life expectancy,probably because of the increased emotional stress exerted on parents who have lost a child at birth.
Correct Answer:
Verified
Q13: The figure below shows the recent trend
Q14: The table below shows the gestation (in
Q15: The scatterplot below shows the percentage of
Q16: Which of the labeled points below are
Q17: Which of the labeled points below are
Q19: The table below shows the age and
Q20: The figure below shows the life expectancy
Q22: A reporter studied the causes of a
Q23: An economist noticed that nations with more
Q29: A university studied students' grades and established
Unlock this Answer For Free Now!
View this answer and more for free by performing one of the following actions

Scan the QR code to install the App and get 2 free unlocks

Unlock quizzes for free by uploading documents