The scatterplot below shows the percentage of the US population that is foreign born for the years 1910 - 1990.For what range of years is a linear model appropriate? 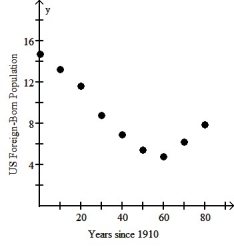
A) One linear model is appropriate for the years 1910 through 1950 and another linear model for the years 1950 through 1990.
B) A linear model should be used for each pair of adjacent data points.
C) One linear model is appropriate for the years 1910 through 1970 and another linear model for the years 1970 through 1990.
D) A linear model should not be used for any part of the data.
E) A single linear model is appropriate for the entire data set.
Correct Answer:
Verified
Q10: The scatterplot below displays the average longevity
Q11: Which of the labeled points below will
Q12: Over a period of years,a certain town
Q13: The figure below shows the recent trend
Q14: The table below shows the gestation (in
Q16: Which of the labeled points below are
Q17: Which of the labeled points below are
Q18: The figure below shows the association between
Q19: The table below shows the age and
Q20: The figure below shows the life expectancy
Unlock this Answer For Free Now!
View this answer and more for free by performing one of the following actions

Scan the QR code to install the App and get 2 free unlocks

Unlock quizzes for free by uploading documents