Over a period of years,a certain town observed the association between the number of people attending churches and the number of people in the city jail.The results are shown on the figure below.Also shown are the equation and R2 value from a linear regression analysis.What is the best conclusion to draw from the figure? 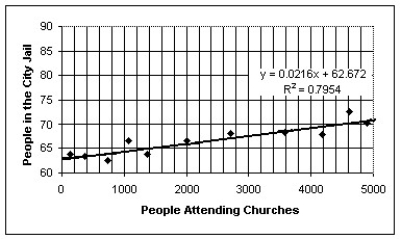
A) Although the association is negatively strong,going to church does not cause people to go to jail.Instead,size of the population in the town is probably a lurking variable that drives both the number of people in jail and the number of people attending church to increase together.
B) More detainees should go to church to improve their behavior.
C) Although the association is positively strong,going to church does not cause people to go to jail.Instead,size of the population of the town is probably a lurking variable that drives both the number of people in jail and the number of people attending church to increase together.
D) More people go to church not to go to jail.
E) Clearly,there must be some as-yet unknown problems associated with going to church.
Correct Answer:
Verified
Q7: Which of the labeled points below will
Q8: The figure below examines the association between
Q9: The table below displays the latitude (degrees
Q10: The scatterplot below displays the average longevity
Q11: Which of the labeled points below will
Q13: The figure below shows the recent trend
Q14: The table below shows the gestation (in
Q15: The scatterplot below shows the percentage of
Q16: Which of the labeled points below are
Q17: Which of the labeled points below are
Unlock this Answer For Free Now!
View this answer and more for free by performing one of the following actions

Scan the QR code to install the App and get 2 free unlocks

Unlock quizzes for free by uploading documents