The table below displays the latitude (degrees north) and average daily minimum temperature in January (in degrees Fahrenheit) for some cities located in the northern hemisphere. 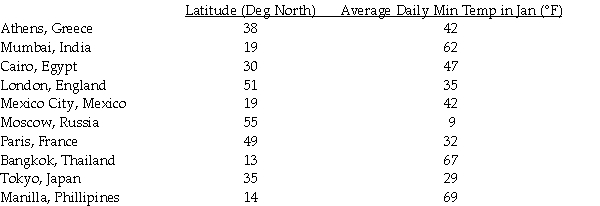
The scatter plot and regression equation are shown below: 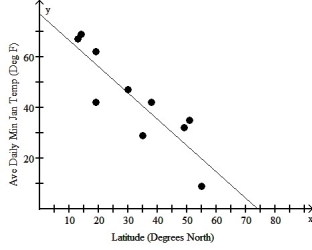
The regression analysis of this data yields the following values: 
R2 = 0.7660
Use this model to predict the average daily minimum temperature in January for Panama City whose latitude is 9 degrees north.
A) 9.3° F
B) 67.6° F
C) 86.3° F
D) 61.5° F
E) 54.0° F
Correct Answer:
Verified
Q4: The scatterplot below displays the total home
Q5: The figure below shows the association between
Q6: The scatterplot below displays world population (in
Q7: Which of the labeled points below will
Q8: The figure below examines the association between
Q10: The scatterplot below displays the average longevity
Q11: Which of the labeled points below will
Q12: Over a period of years,a certain town
Q13: The figure below shows the recent trend
Q14: The table below shows the gestation (in
Unlock this Answer For Free Now!
View this answer and more for free by performing one of the following actions

Scan the QR code to install the App and get 2 free unlocks

Unlock quizzes for free by uploading documents