The scatterplot below displays the average longevity (in years) plotted against gestation (in days) for a number of different mammals.For what range of gestation lengths is a linear model appropriate? 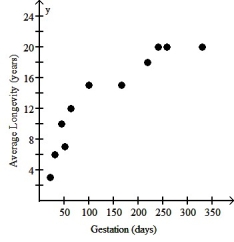
A) A linear model should not be used for any part of the data.
B) One linear model for 0 through 200 days and another linear model for 200 through 350 days.
C) A single linear model is appropriate for the entire data set.
D) One linear model for 0 through 100 days and another linear model for 150 through 350 days.
E) A linear model should be used for each pair of adjacent data points.
Correct Answer:
Verified
Q5: The figure below shows the association between
Q6: The scatterplot below displays world population (in
Q7: Which of the labeled points below will
Q8: The figure below examines the association between
Q9: The table below displays the latitude (degrees
Q11: Which of the labeled points below will
Q12: Over a period of years,a certain town
Q13: The figure below shows the recent trend
Q14: The table below shows the gestation (in
Q15: The scatterplot below shows the percentage of
Unlock this Answer For Free Now!
View this answer and more for free by performing one of the following actions

Scan the QR code to install the App and get 2 free unlocks

Unlock quizzes for free by uploading documents