The figure below examines the association between life expectancy and computer ownership for several countries.Also shown are the equation and R2 value from a linear regression analysis.What is the best conclusion to draw from the figure? 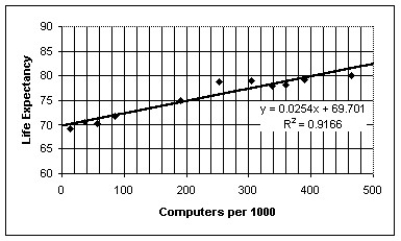
A) Exposure to the radiation from computer monitors is causing a clear decline in life expectancy.
B) Persons who live longer buy more computers over the course of their longer lifetimes.
C) Although the association is strong,computer ownership probably does not promote longevity.Instead,national per capita wealth is probably a lurking variable that drives both life expectancy and computer ownership.
D) Computer ownership promotes health and long life,probably due to the greater access that computer owners have to health information on the world-wide web.
E) Clearly,there must be some as-yet unknown health benefit associated with using computers.
Correct Answer:
Verified
Q3: Which of the labeled points below are
Q4: The scatterplot below displays the total home
Q5: The figure below shows the association between
Q6: The scatterplot below displays world population (in
Q7: Which of the labeled points below will
Q9: The table below displays the latitude (degrees
Q10: The scatterplot below displays the average longevity
Q11: Which of the labeled points below will
Q12: Over a period of years,a certain town
Q13: The figure below shows the recent trend
Unlock this Answer For Free Now!
View this answer and more for free by performing one of the following actions

Scan the QR code to install the App and get 2 free unlocks

Unlock quizzes for free by uploading documents