The following diagram shows a close-up view of the vapor pressure curves for two pure liquids and two different solutions composed of these two liquids.Which curves represent pure liquids and which curves represent the solutions? 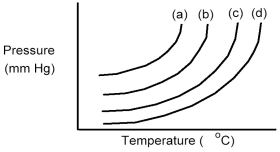
A) Curves (a) and (b) are the pure liquids and curves (c) and (d) are the solutions.
B) Curves (a) and (c) are the pure liquids and curves (b) and (d) are the solutions.
C) Curves (a) and (d) are the pure liquids and curves (b) and (c) are the solutions.
D) Curves (c) and (d) are the pure liquids and curves (a) and (b) are the solutions.
Correct Answer:
Verified
Q77: How many grams of sucrose,C12H22O11,must be added
Q78: When ethylene glycol,HOCH2CH2OH,is added to the water
Q79: An aqueous CsCl solution is 8.00 wt%
Q80: A solution of 0.2113 g of water
Q81: Drawing (1)shows the equilibrium vapor pressure of
Unlock this Answer For Free Now!
View this answer and more for free by performing one of the following actions

Scan the QR code to install the App and get 2 free unlocks

Unlock quizzes for free by uploading documents