Samples of 200 parts were taken every day and the number of defectives was counted. What are the upper and lower limits for the percent defective chart? 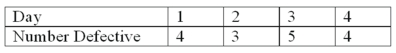
A) 0.02 and 0
B) 0.2970 and 0
C) 0.0297 and 0
D) 0.0497 and 0
Correct Answer:
Verified
Q2: What is usually developed to evaluate a
Q14: Which probability distribution is used to develop
Q22: A sampling plan states that if 20
Q27: What process investigates the potential causes of
Q30: The technique that tallies types of defects
Q31: Which probability distribution is used to develop
Q32: A fishbone diagram classifies potential causes into
Q37: The cause-and-effect chart is an example of
Q40: Equipment failure would be an example of
Q47: What type of variation can be reduced,
Unlock this Answer For Free Now!
View this answer and more for free by performing one of the following actions

Scan the QR code to install the App and get 2 free unlocks

Unlock quizzes for free by uploading documents