 Figure 13-5A
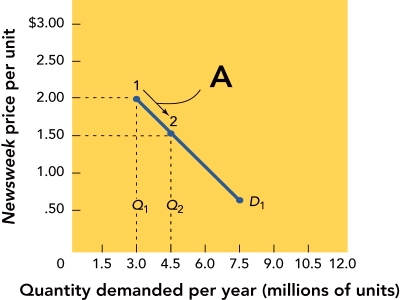
-Figure 13-5A above shows that when the price moves from $2.00 to $1.50 per unit along the demand curve D1,the quantity demanded
A) increases from 3.0 to 4.5 million units per year.
B) decreases from 4.5 to 3.0 million units per year.
C) stays the same.
D) increases from 3.0 to 7.5 million units per year.
E) decreases from 7.5 to 3.0 million units per year.
Correct Answer:
Verified
Q182: There are a lot of skateboards on
Q184: Forever Quilting is a small company that
Q184: Renfro's,Inc. ,is a company that sells 25
Q185: Which of the following illustrates a shift
Q186: Q190: total money received from the sale of Q191: a price of $3.00 each,SHAPE magazine sells Q193: shift of the demand curve from D1![]()
Unlock this Answer For Free Now!
View this answer and more for free by performing one of the following actions

Scan the QR code to install the App and get 2 free unlocks

Unlock quizzes for free by uploading documents