 Figure 13-5B
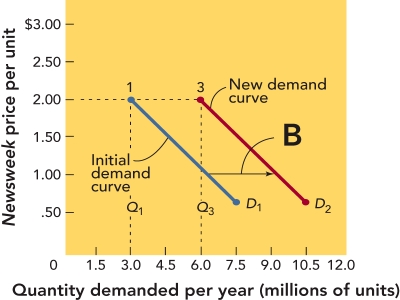
-Figure 13-5B above,the demand curve shifts from D1 to D2.This most likely represents
A) an increase in demand that did not require a decrease in price.
B) an increase in demand that required an increase in price.
C) no change in price and no change in demand.
D) no change in demand or price but a greater profit due to economies of scale.
E) an increase in price from $0.50 to $1.50 per unit.
Correct Answer:
Verified
Q141: Which of the following statements about the
Q184: Renfro's,Inc. ,is a company that sells 25
Q189: Q190: total money received from the sale of Q191: a price of $3.00 each,SHAPE magazine sells Q193: shift of the demand curve from D1 Q195: Total revenue refers to Q196: a price of $4.00 each,SHAPE magazine sells![]()
A) the profit made
Unlock this Answer For Free Now!
View this answer and more for free by performing one of the following actions

Scan the QR code to install the App and get 2 free unlocks

Unlock quizzes for free by uploading documents