 Figure 13-5B
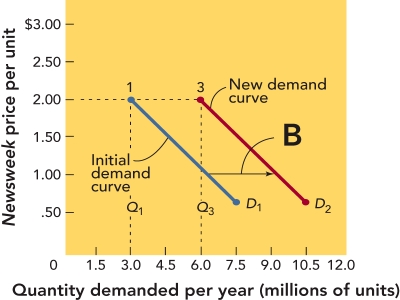
-Figure 13-5B above shows that when the quantity demanded moves from 3.0 to 6.0 million units along the demand curve D1,the profit
A) increases from $1.50 to $2.00 per unit.
B) decreases from $2.00 to $1.50 per unit.
C) stays the same per unit.
D) increases from $0.50 to $1.50 per unit.
E) Figure 13-5B does not indicate what happens to profit when the quantity demanded moves.
Correct Answer:
Verified
Q141: Which of the following statements about the
Q184: Renfro's,Inc. ,is a company that sells 25
Q193: shift of the demand curve from D1
Q194: Q195: Total revenue refers to Q196: a price of $4.00 each,SHAPE magazine sells Q200: Which of the following statements most likely Unlock this Answer For Free Now! View this answer and more for free by performing one of the following actions Scan the QR code to install the App and get 2 free unlocks Unlock quizzes for free by uploading documents![]()
A) the profit made

