Marketing Dashboard Map -The Marketing Dashboard Map Shown Above,"green" Indicates an Annual Growth
 Marketing Dashboard Map
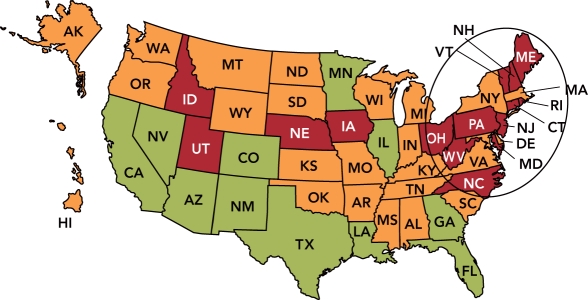
-the marketing dashboard map shown above,"green" indicates an annual growth rate that is greater than 10%; "orange" signifies an annual growth rate of between 0%-10%; and "red" represents a decline or negative annual growth rate.If an organization's 2011 sales for the entire U.S.were $50 million and its 2010 U.S.sales were $30 million,what is the annual % sales change?
A) 33%
B) 67%
C) 100%
D) 125%
E) 133%
Correct Answer:
Verified
Q104: Industrial services are support products that include
Q119: Vermont Teddy Bear Company sells handmade Teddy
Q121: Vermont Teddy Bear Company sells handmade Teddy
Q122: Feature bloat is
A) an exaggeration of a
Q125: of the different product lines offered by
Q126: During a recent shopping trip to a
Q127: you are using a marketing dashboard to
Q128: proliferation of extra features that overwhelms many
Unlock this Answer For Free Now!
View this answer and more for free by performing one of the following actions

Scan the QR code to install the App and get 2 free unlocks

Unlock quizzes for free by uploading documents