Which of the following diagrams represents the cardinality pairs in a situation where a finished product requires one or more machine operations,and machines usage is recorded to specific production runs?
A) 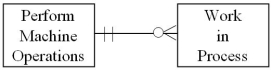
B) 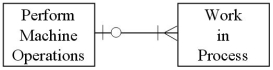
C) 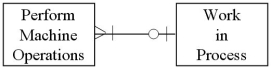
D) 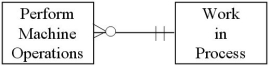
Correct Answer:
Verified
Q48: Which of the following diagrams represents the
Q49: Which of the following diagrams represents the
Q50: There are four main events of interest
Q51: Which of the following diagrams represents the
Q52: Which of the following diagrams represents the
Q55: Which of the following diagrams represents the
Q56: Which of the following diagrams represents the
Q57: Which of the following accurately represents typical
Q58: Which of the following diagrams represents the
Q80: Employee number is most likely to be
Unlock this Answer For Free Now!
View this answer and more for free by performing one of the following actions

Scan the QR code to install the App and get 2 free unlocks

Unlock quizzes for free by uploading documents