Which of the following diagrams represents the cardinality pairs in a situation where supervisors conduct individual performance evaluations with each of the employees they supervise?
A) 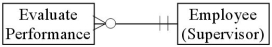
B) 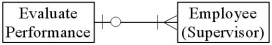
C) 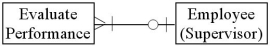
D) 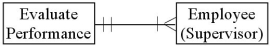
Correct Answer:
Verified
Q44: What are the benefits of an integrated
Q53: Which of the following diagrams represents the
Q55: Which of the following diagrams represents the
Q56: Which of the following diagrams represents the
Q57: Which of the following accurately represents typical
Q59: Which of the following diagrams represents the
Q60: Which of the following diagrams represents the
Q60: Why might an REA diagram show relationships
Q80: Employee number is most likely to be
Q97: Describe the relationships between Recruiting event and
Unlock this Answer For Free Now!
View this answer and more for free by performing one of the following actions

Scan the QR code to install the App and get 2 free unlocks

Unlock quizzes for free by uploading documents