Use the figure for the question(s) below. 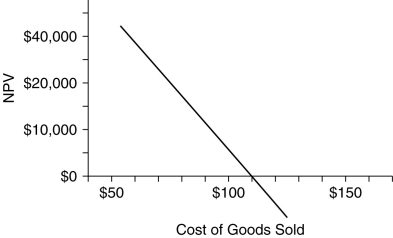
-The graph above shows the break-even analysis for the cost of making a certain good. Based on this chart, which of the following is true?
A) The project should not be undertaken if the predicted cost of goods sold is less than $110.
B) The net present value (NPV) of the project increases with increased cost of goods sold.
C) If the good costs $110 to make, the net present value (NPV) of the project will be zero.
D) The net present value (NPV) of the project will be positive if the cost of goods sold is greater than $110.
Correct Answer:
Verified
Q64: A consumer good company is developing a
Q65: Firms should use the most accelerated depreciation
Q65: A consumer good company is developing a
Q68: Use the figure for the question(s)below.
Q68: What are the most difficult parts of
Q70: A company planning to market a new
Q71: A company spends $20 million researching whether
Q72: An insurance office owns a large building.
Q73: What is 'break-even analysis'?
Q74: Use the figure for the question(s)below.
Unlock this Answer For Free Now!
View this answer and more for free by performing one of the following actions

Scan the QR code to install the App and get 2 free unlocks

Unlock quizzes for free by uploading documents